What's inside
Every Section Your Buyer's Compliance Team Looks For
Eight of the seventeen pages, exactly as generated — no retouching.
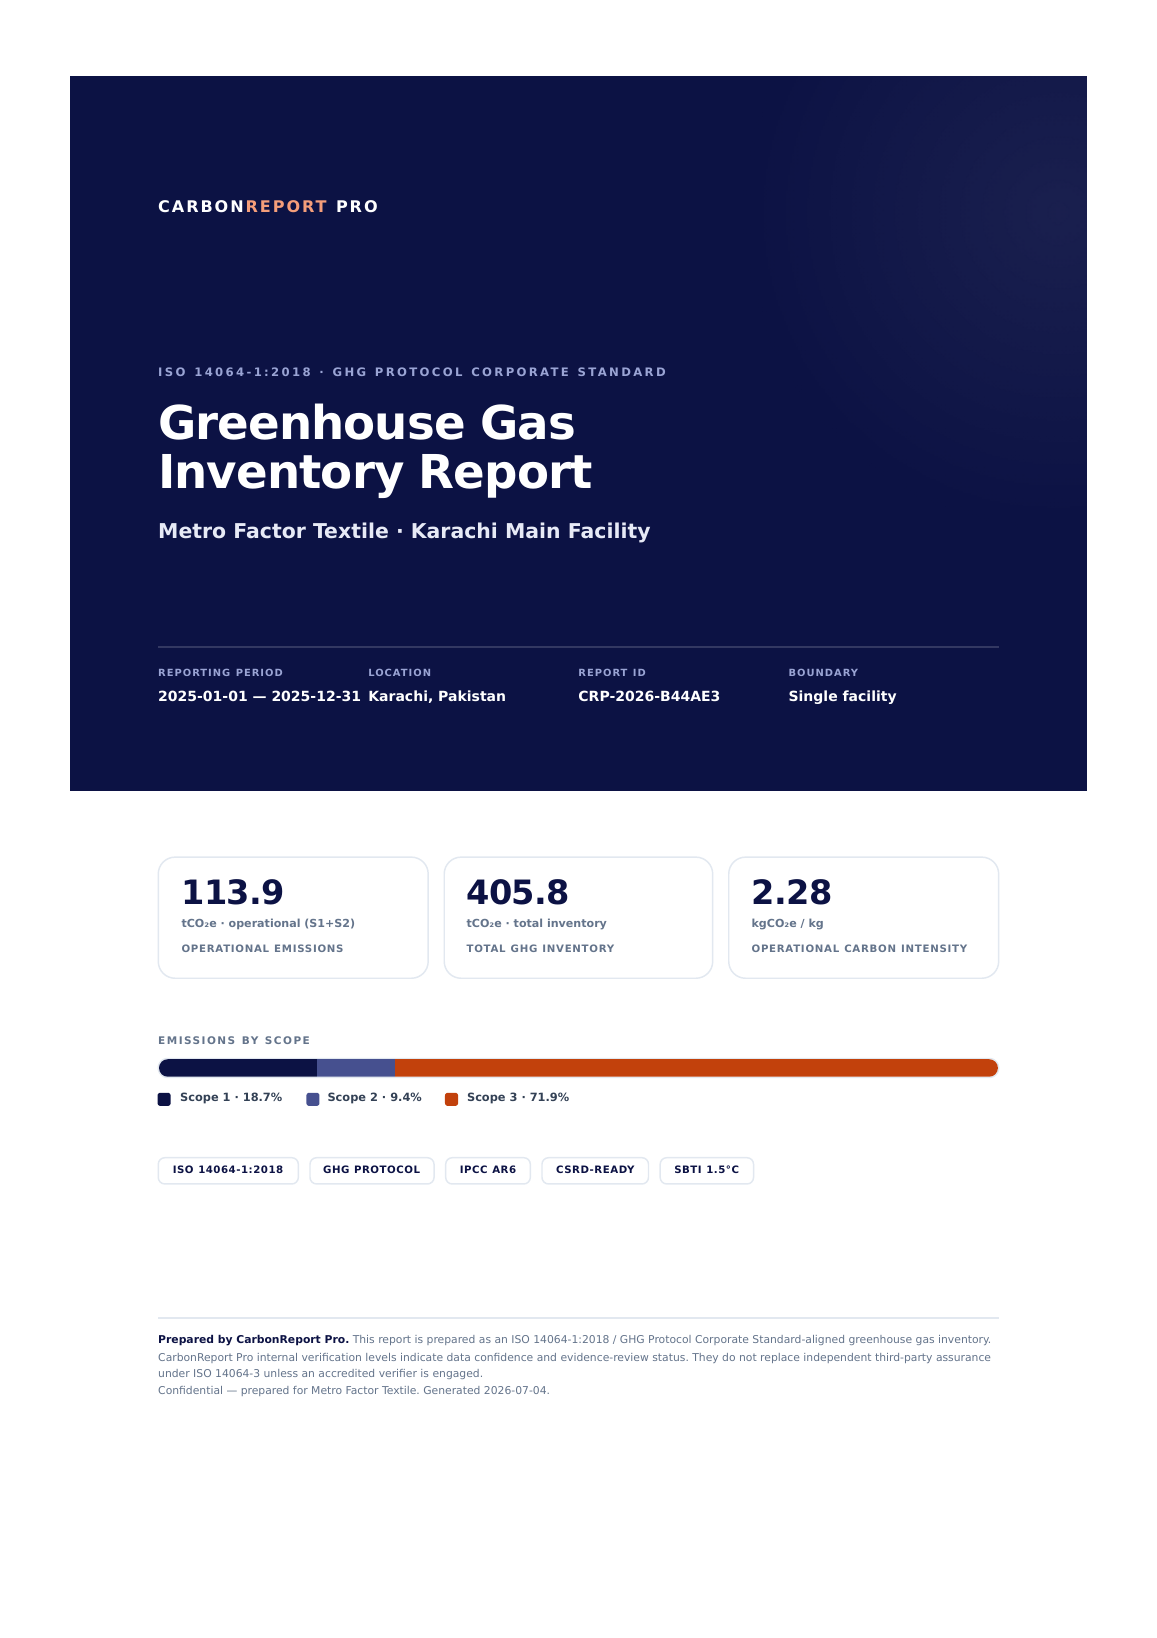
Cover & headline figures
Report ID, boundary, operational vs total split
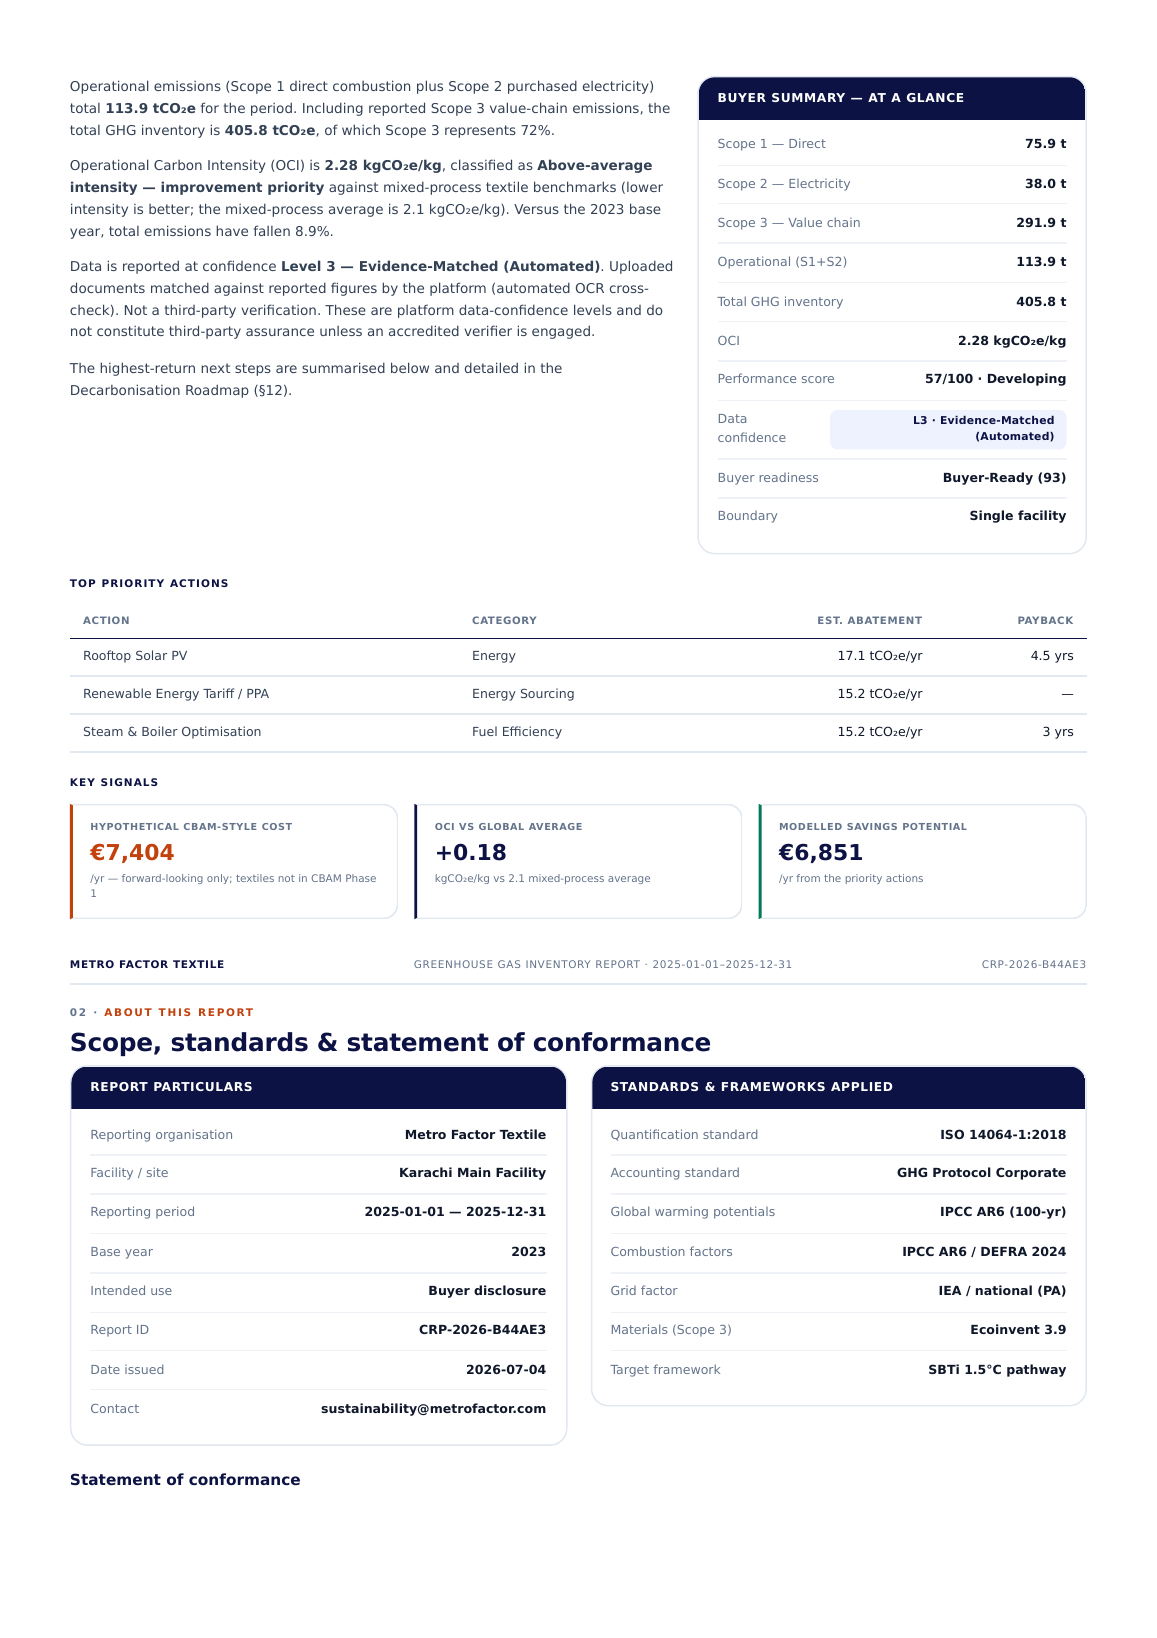
Executive summary
Plain-language findings for decision makers
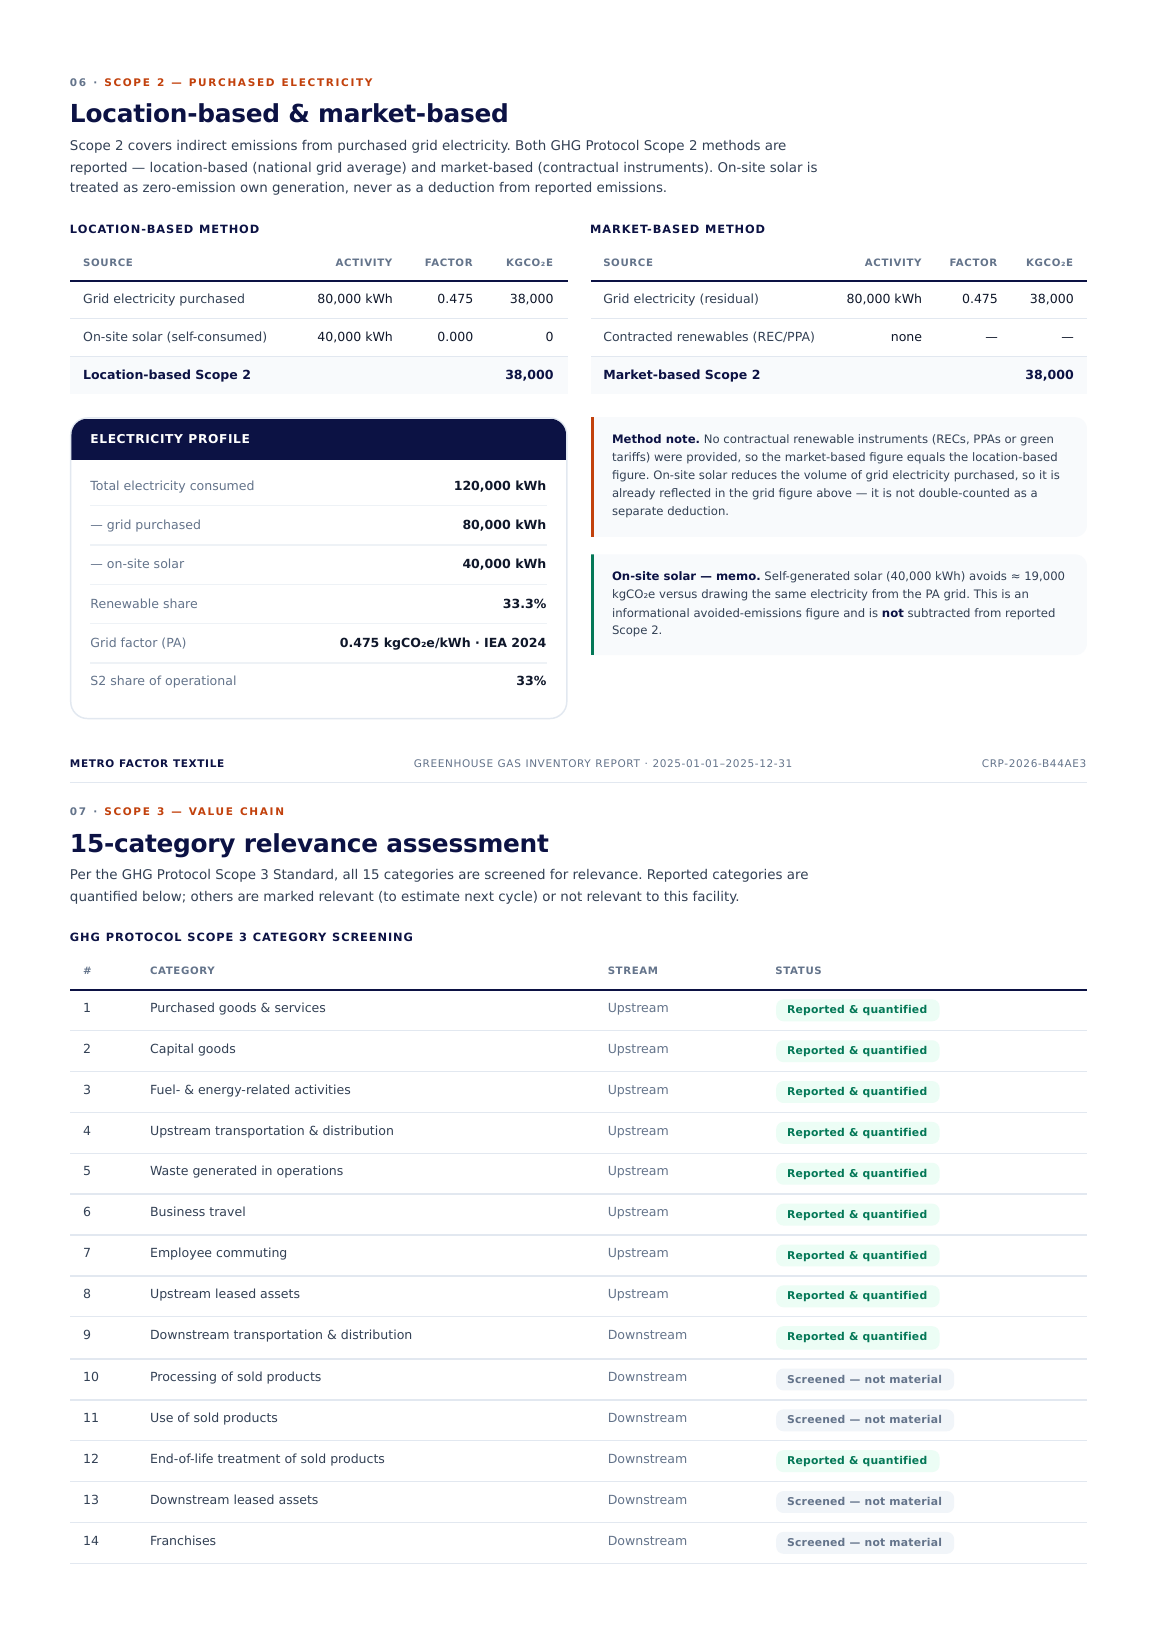
Scope 2 — electricity
Location-based & market-based, factor sources
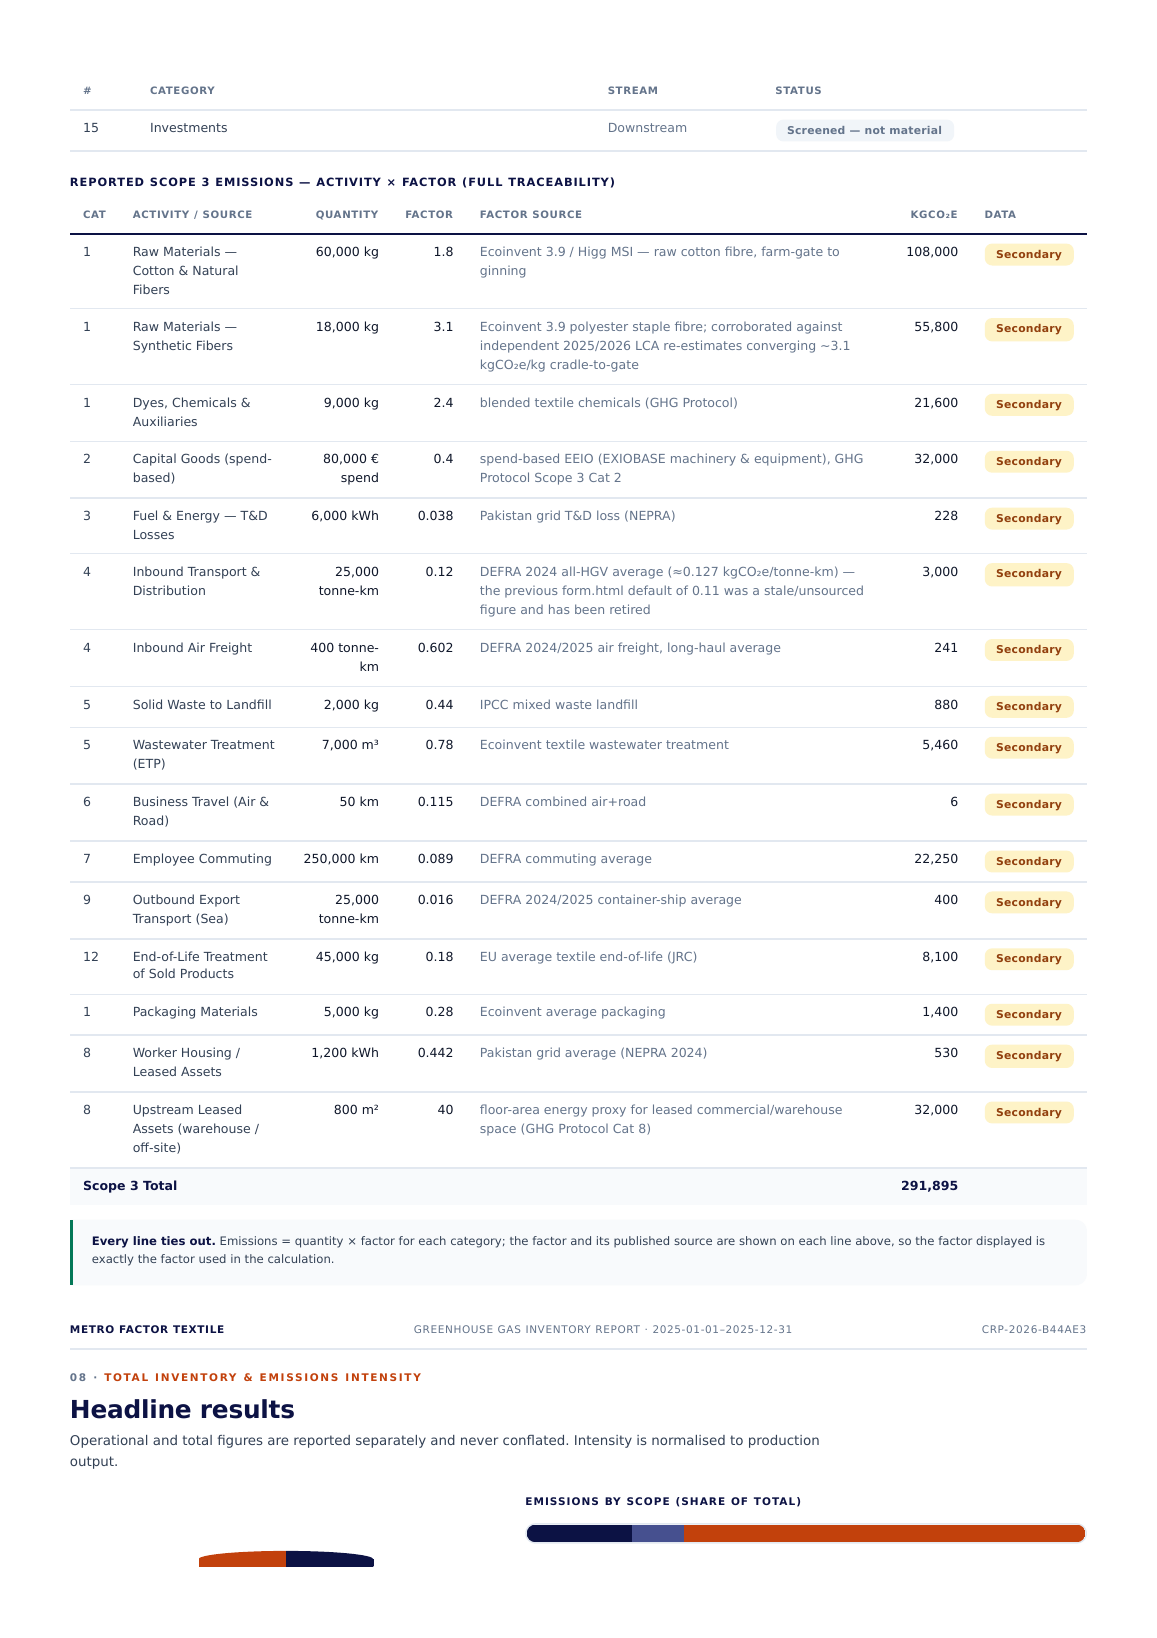
Scope 3 — all 15 categories
Reported, screened and excluded — with reasons
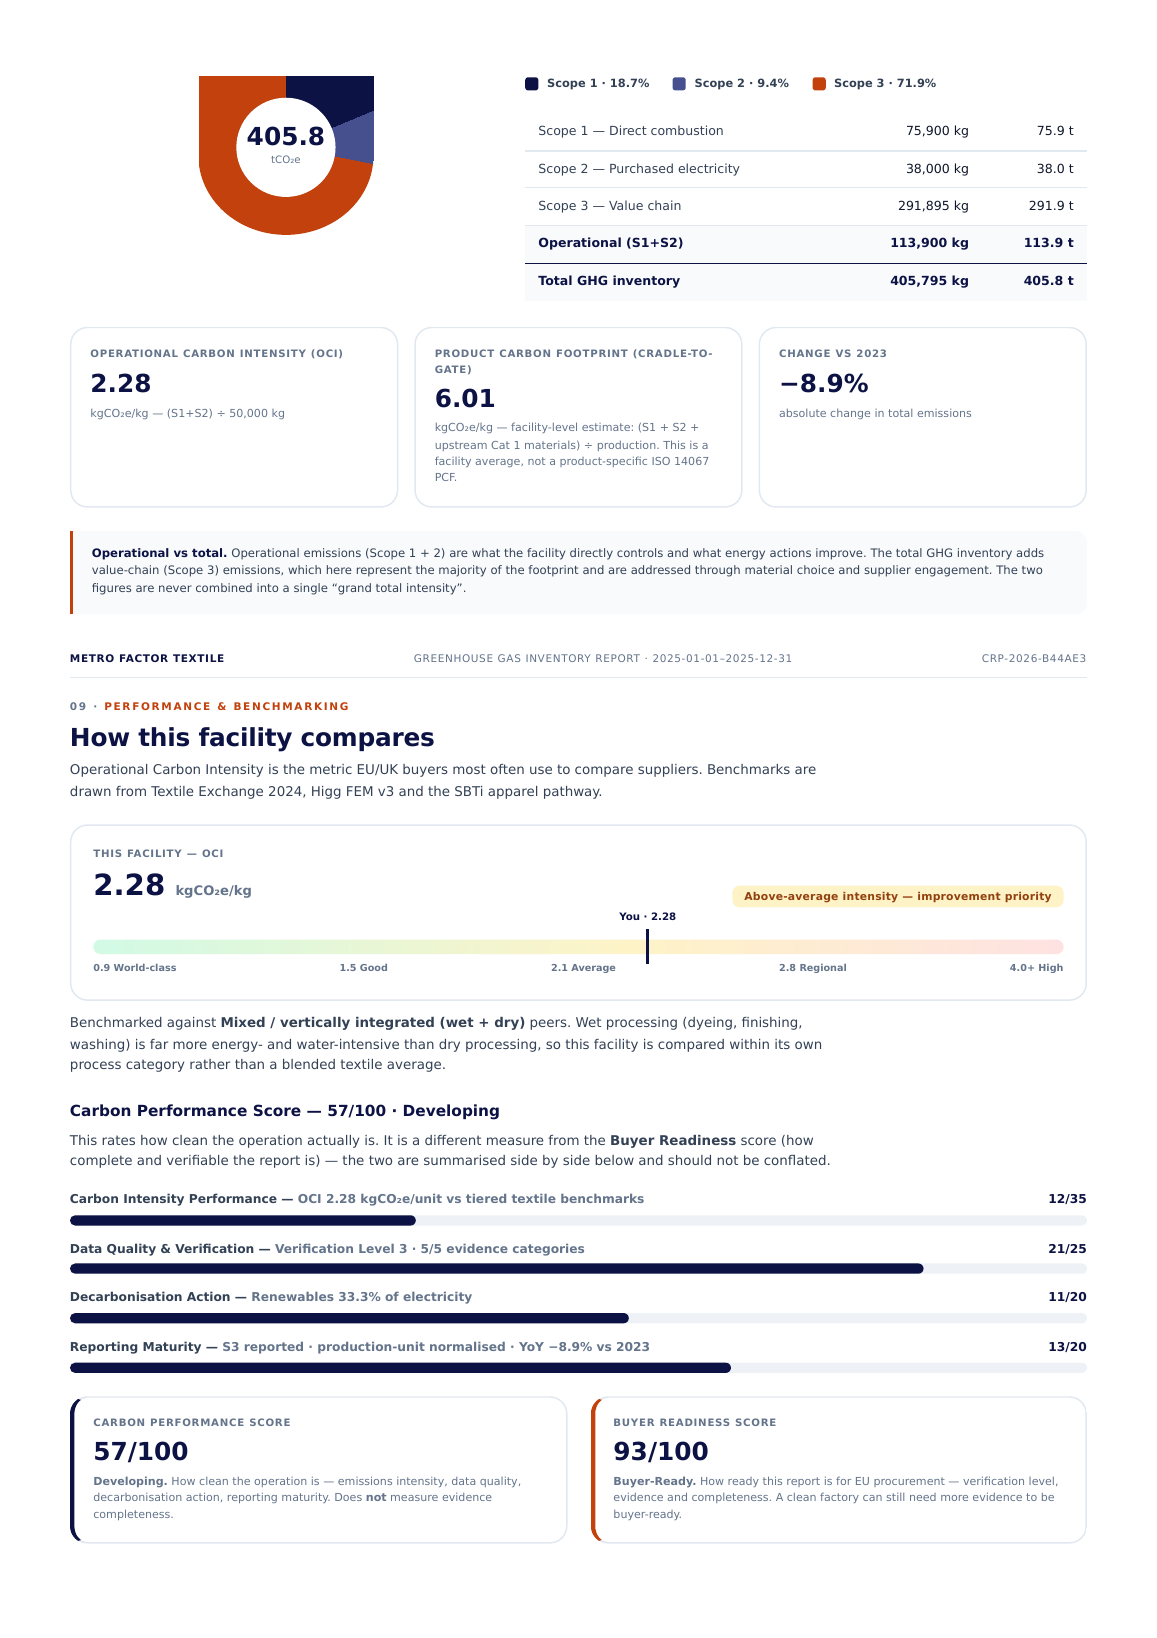
Total inventory & intensity
Donut, scope shares, OCI normalised to output
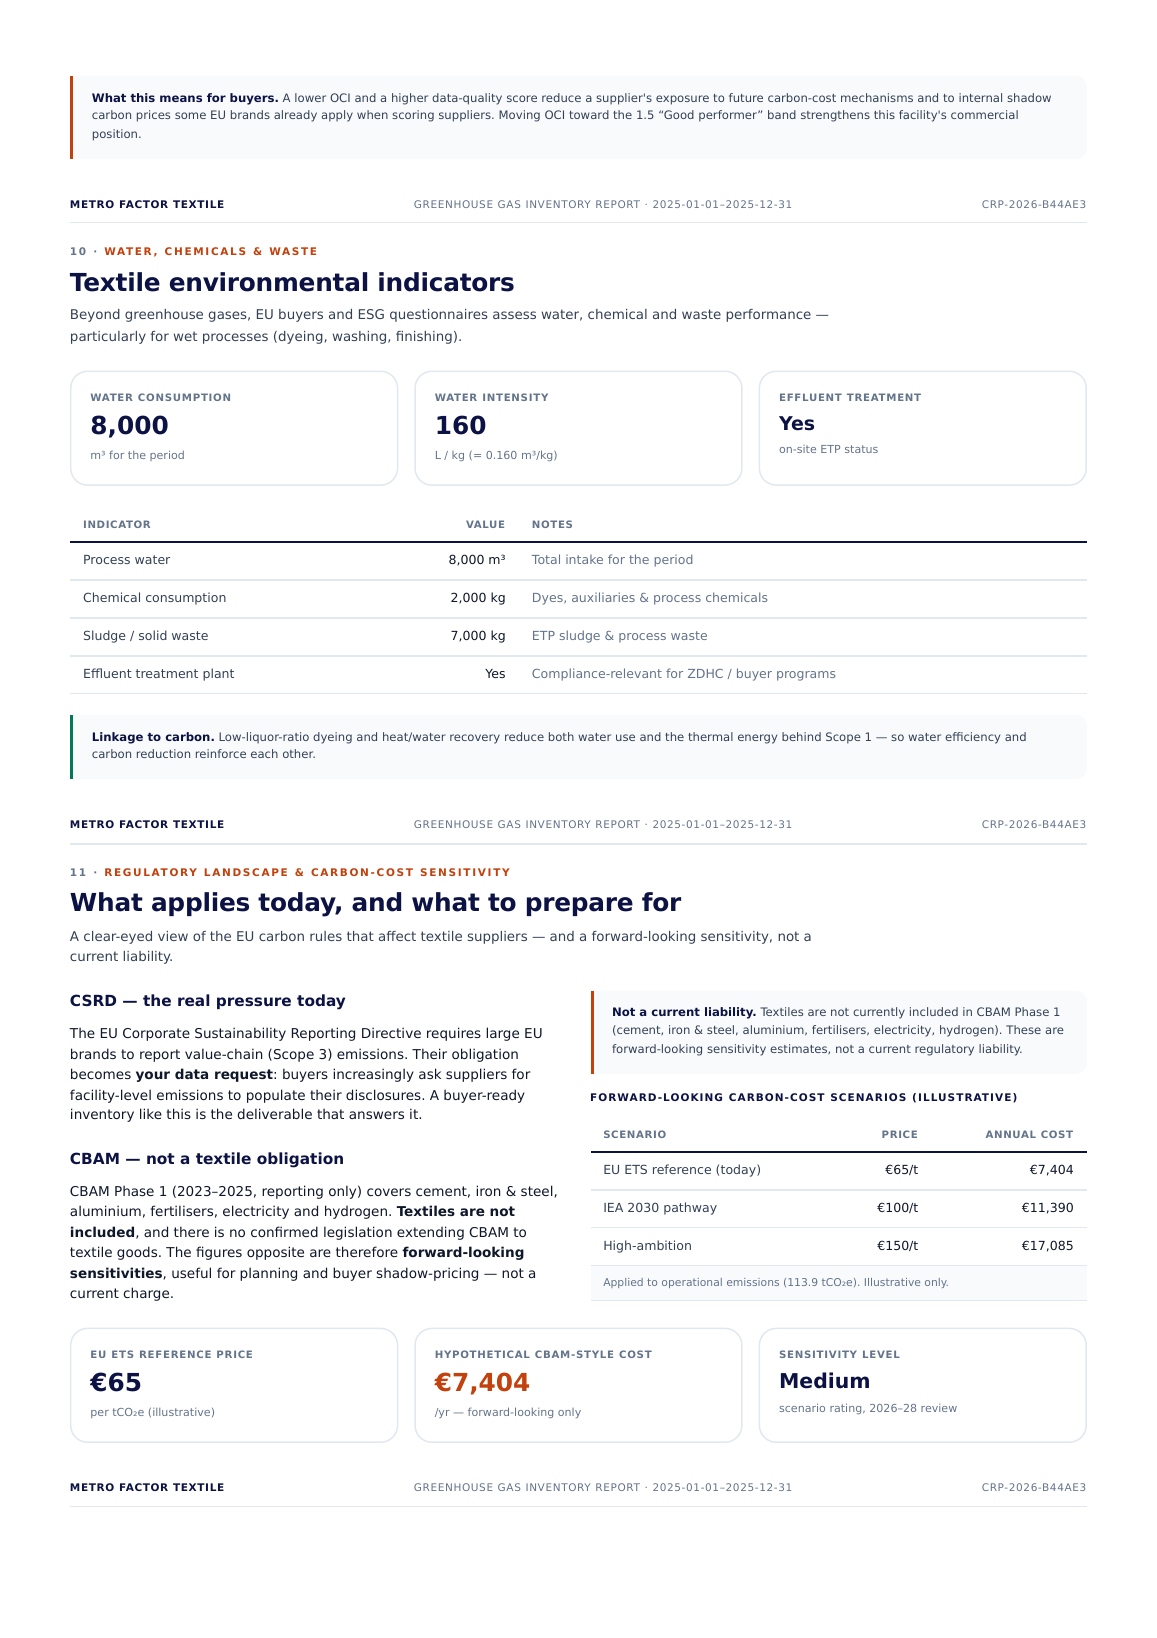
Benchmarking & carbon cost
Peer comparison + forward-looking CBAM sensitivity
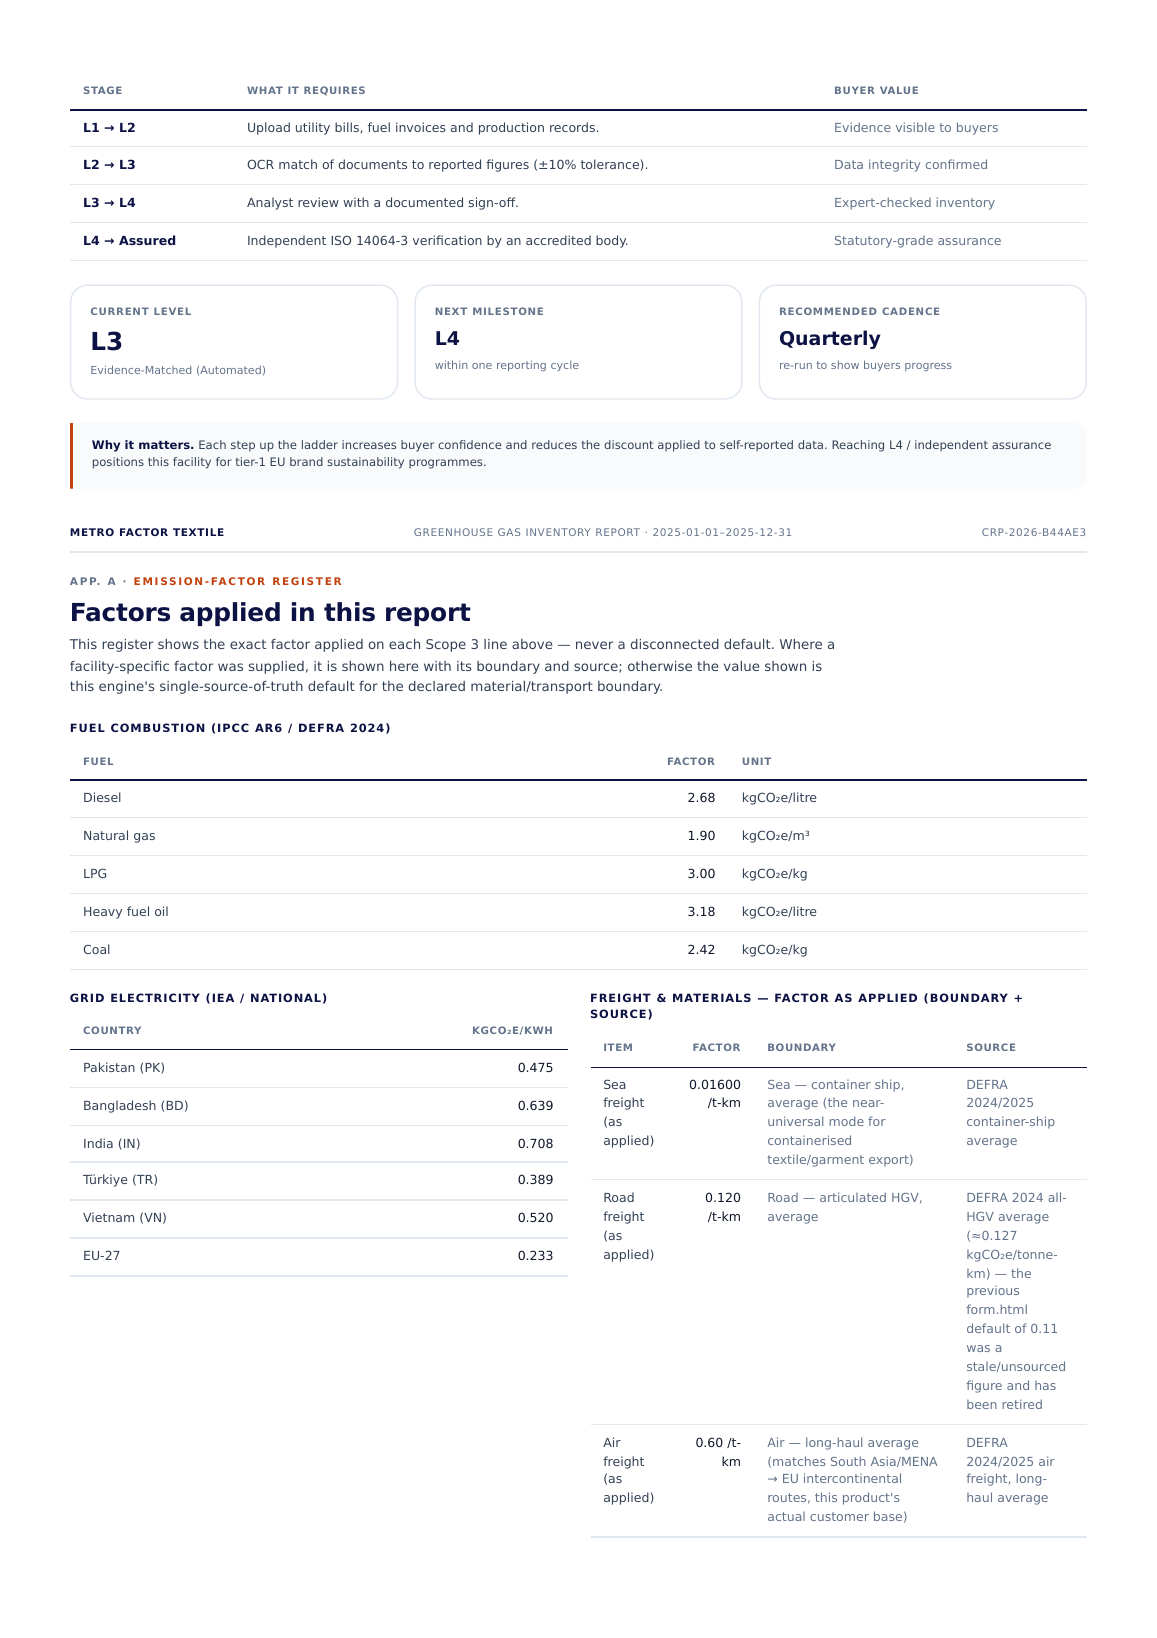
Verification levels
L1–L4 ladder — what each level does and doesn't claim
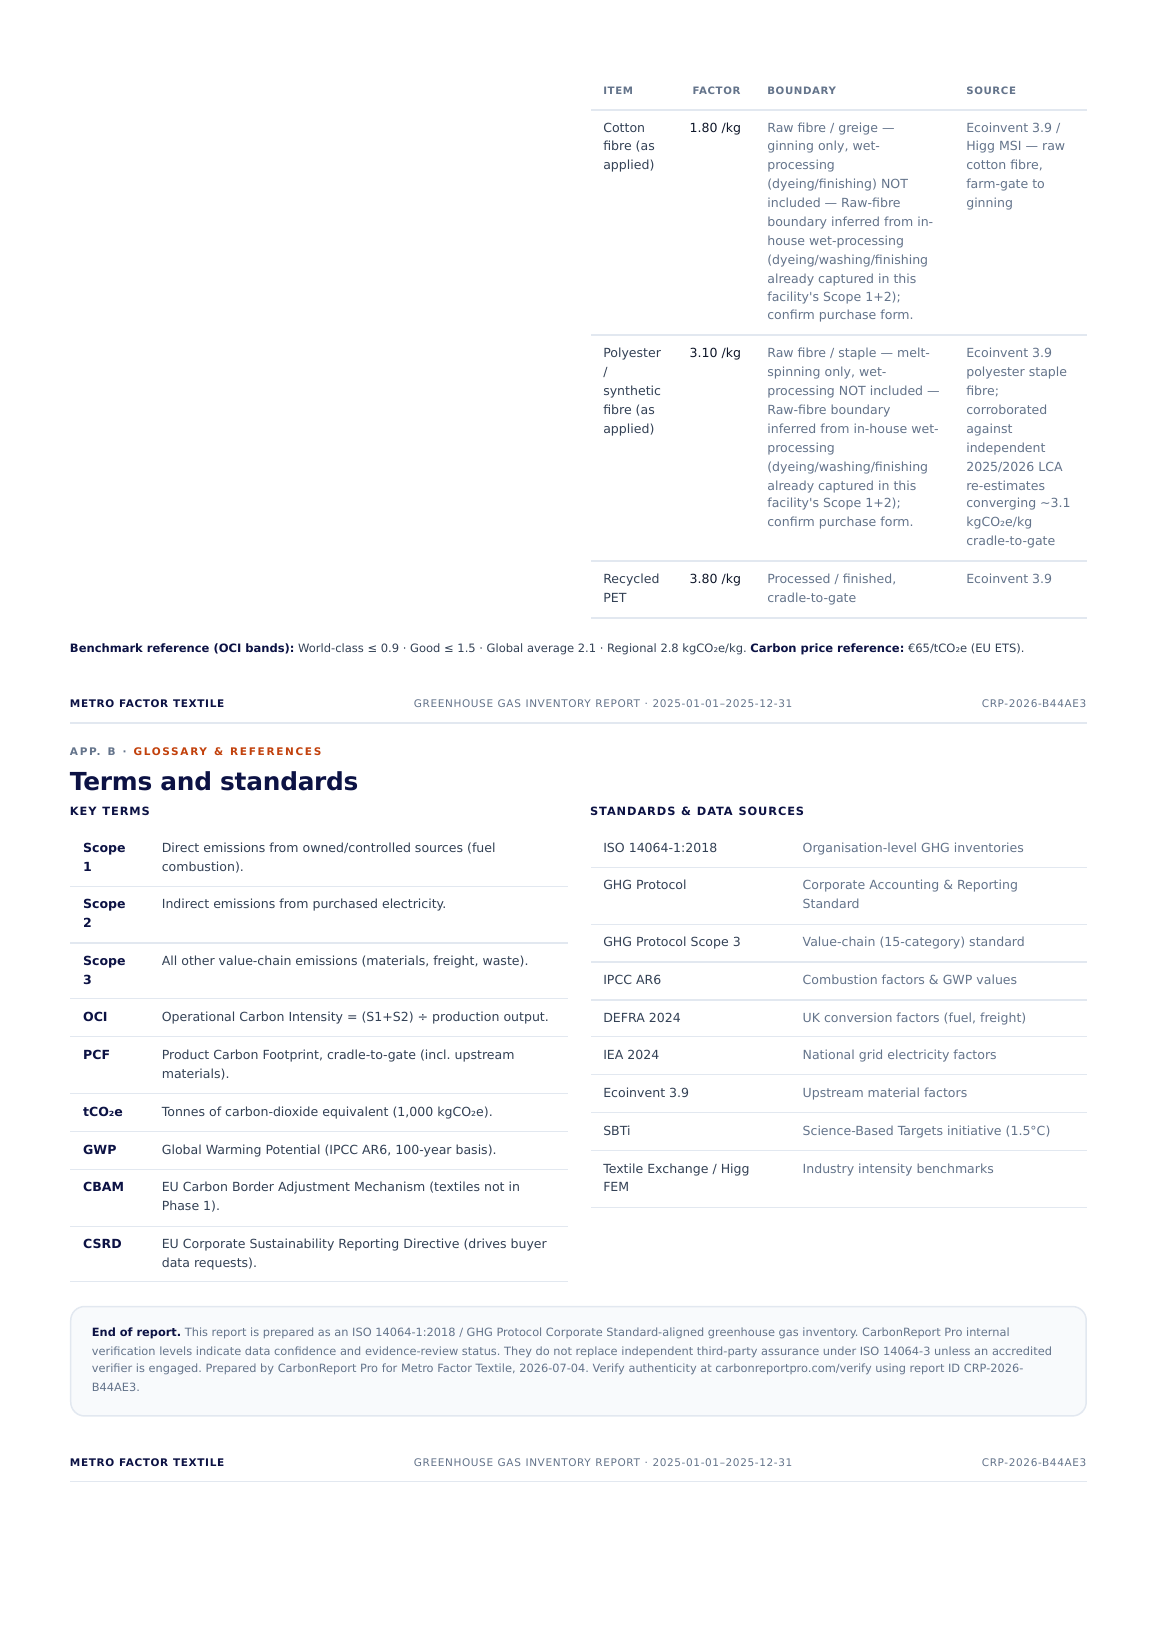
Emission factor register
Every factor, boundary and source — fully auditable